大家好,欢迎来到IT知识分享网。
python 中matplotlib库入门(1)——绘制折线图
导入库
import matplotlib.pyplot as plt
为了方便使用,将pyplot命名为plt
引入数组
squares = [1, 4, 9, 16, 25]
values = [1, 2, 3, 4, 5]
这个squares数组元素代表的是点的y值,values数组代表的是点的x值
如果列表的x值是从0开始,每次加一,则可以不引入x值的数组
设置线条
plt.plot(values, squares, linewidth=4)
第一个元素为x轴,第二个为y轴,第三个为线条的宽度
添加标签
plt.title("Square Number",fontsize=14)
plt.xlabel("Value", fontsize=14)
plt.ylabel("Square of Value", fontsize=14)
” “内的文字为标题,fontsize的值则为文字的大小,若不设置,系统会给出一个默认值
设置刻度标记
plt.tick_params(axis='x', labelsize=10)
plt.axis([0, 6, 0, 30])
里面的值设置为x,则为x轴,both则为x和y,labelsize的值为刻度数字的大小
第一次写博客,以后会继续更新我在学习中的一些总结
希望大家三连关注,这对我很重要,哈哈。
运行程序
plt.show()
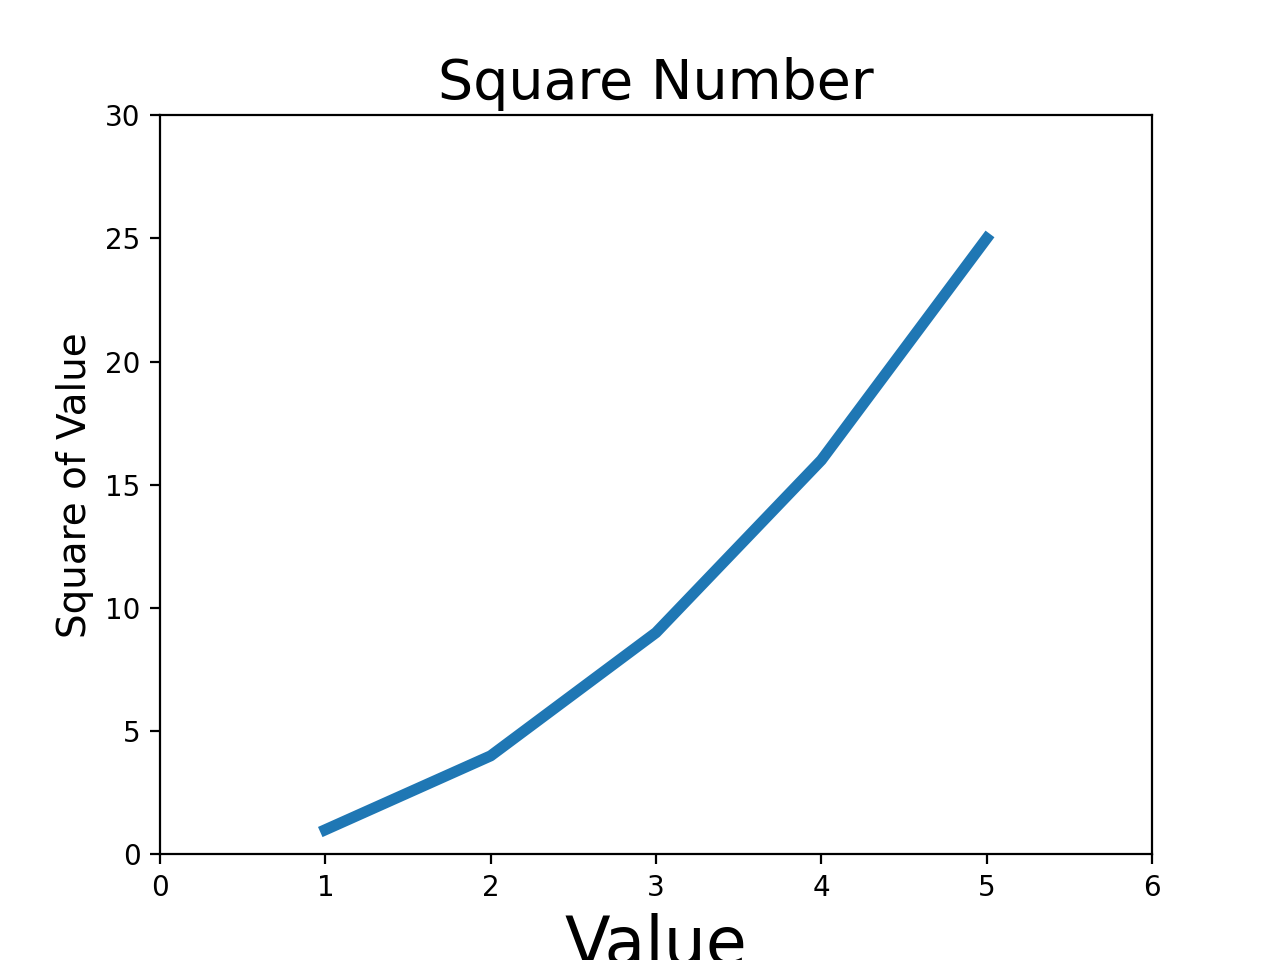
运行结果如下
附上代码
import matplotlib.pyplot as plt
import numpy as np
values = [1, 2, 3, 4, 5]
squares = [1, 4, 9, 16, 25]
plt.plot(values, squares, linewidth=4)
plt.title("Square Number", fontsize=20)
plt.xlabel("Value", fontsize=24)
plt.ylabel("Square of Value", fontsize=14)
plt.tick_params(axis='both',
labelsize=10)
plt.axis([0, 6, 0, 30])
plt.show()
免责声明:本站所有文章内容,图片,视频等均是来源于用户投稿和互联网及文摘转载整编而成,不代表本站观点,不承担相关法律责任。其著作权各归其原作者或其出版社所有。如发现本站有涉嫌抄袭侵权/违法违规的内容,侵犯到您的权益,请在线联系站长,一经查实,本站将立刻删除。 本文来自网络,若有侵权,请联系删除,如若转载,请注明出处:https://yundeesoft.com/12213.html


