大家好,欢迎来到IT知识分享网。
Filtering and Analysis Functions
Filtering
| Function | Description |
|---|---|
|
fftfilt |
Filters a signal with a |
|
filter |
Filters a signal using a |
|
filtfilt |
Performs zero-phase filtering of a signal with a |
Filter Analysis
| Function | Description |
|---|---|
|
double |
Casts the coefficients of a |
|
filt2block |
Generates a Simulink® filter block corresponding to a |
|
filtord |
Returns the filter order of a |
|
firtype |
Returns the type (1, 2, 3, or 4) of an FIR |
|
freqz |
Returns or plots the frequency response of a |
|
fvtool |
Opens the Filter Visualization Tool and displays the magnitude response of a |
|
grpdelay |
Returns or plots the group delay response of a |
|
impz |
Returns or plots the impulse response of a |
|
impzlength |
Returns the length of the impulse response of a |
|
info |
Returns a character array with information about a |
|
isallpass |
Returns |
|
isdouble |
Returns |
|
isfir |
Returns |
|
islinphase |
Returns |
|
ismaxphase |
Returns |
|
isminphase |
Returns |
|
issingle |
Returns |
|
isstable |
Returns |
|
phasedelay |
Returns or plots the phase delay response of a |
|
phasez |
Returns or plots the (unwrapped) phase response of a |
|
single |
Casts the coefficients of a |
|
ss |
Returns the state-space representation of a |
|
stepz |
Returns or plots the step response of a |
|
tf |
Returns the transfer function representation of a |
|
zerophase |
Returns or plots the zero-phase response of a |
|
zpk |
Returns the zero-pole-gain representation of a |
|
zplane |
Displays the poles and zeros of the transfer function represented by a |
1.zero,pole–>transfer function form
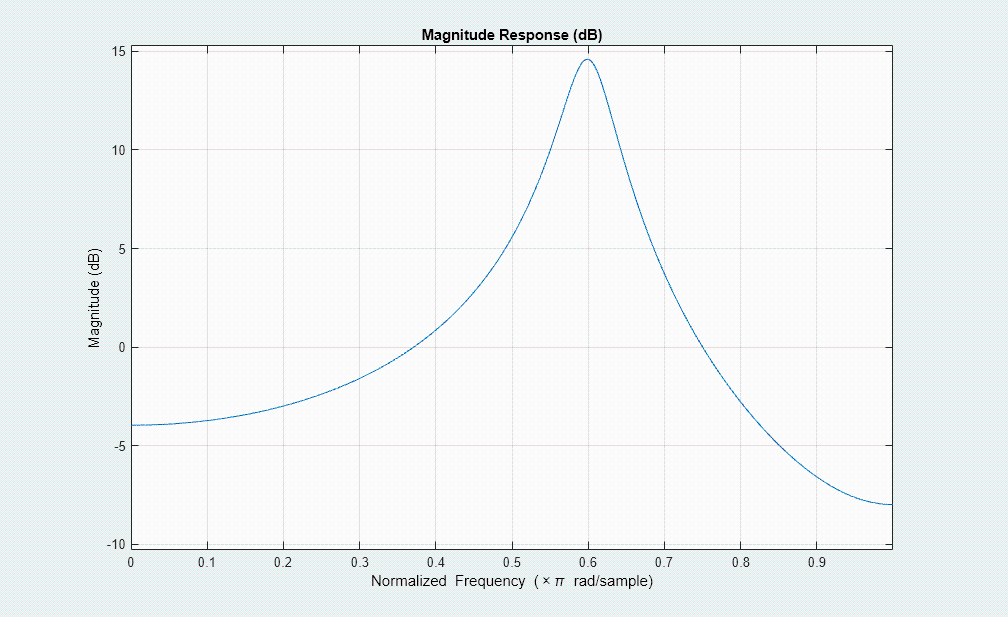
[b,a] = zp2tf(zer,pol,1);
fvtool(b,a)
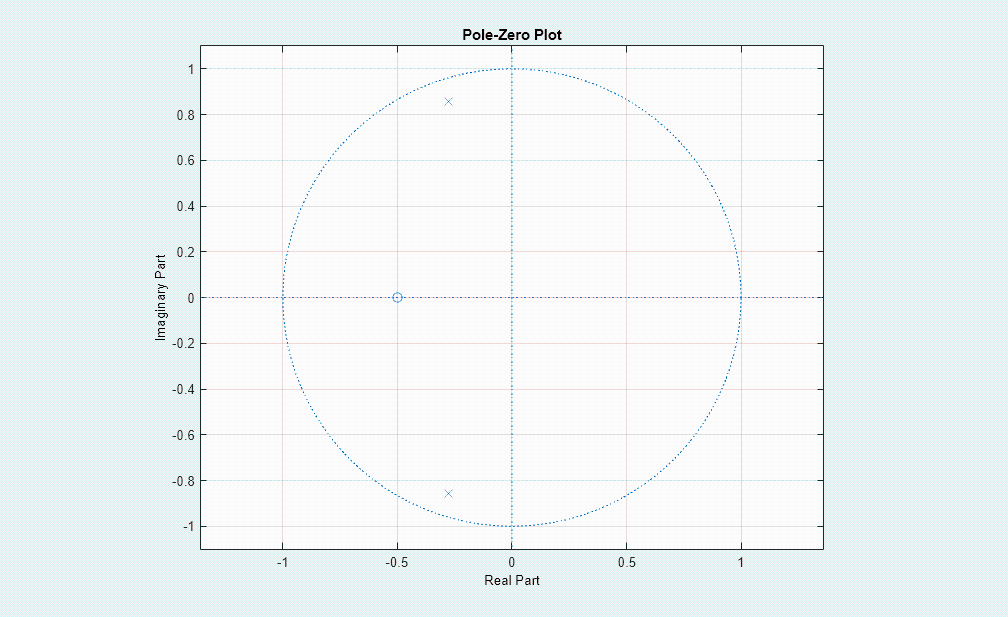
2.transform function–>zero/polo
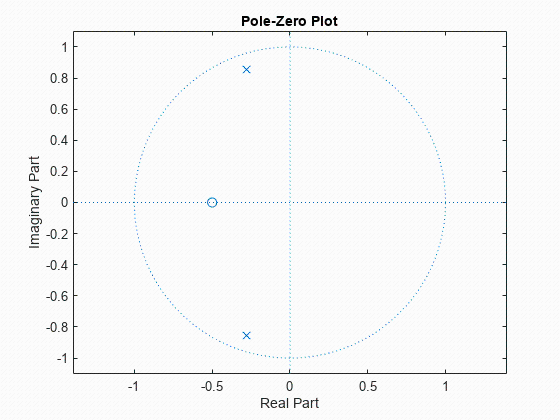
fvtool(b,a,'Analysis','polezero')
zplane(b,a)
3.Z-transform frequency response of a digital filter.
[h,w] = freqz(b,a,p)
returns the p-point complex frequency response, H(ejω), of the digital filter.
For example, a ninth-order Butterworth lowpass filter with a cutoff frequency of 400 Hz, based on a 2000 Hz sampling frequency, is
[b,a] = butter(9,400/1000);
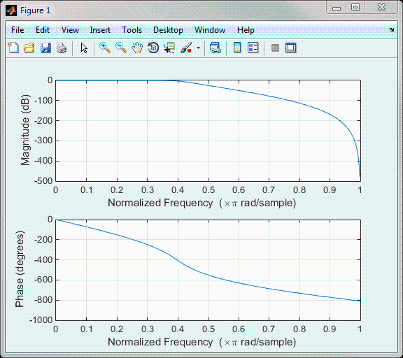
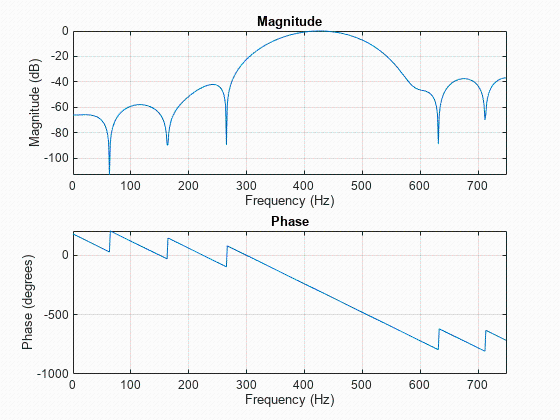
To calculate the 256-point complex frequency response for this filter, and plot the magnitude and phase with freqz, use
freqz(b,a,256,2000)
4.filter
Use filter in the form y = filter(d,x) to filter an input signal, x, with a digitalFilter, d, and obtain output data, y.
5.designfilt(https://ww2.mathworks.cn/help/signal/ref/designfilt.html)
Use designfilt in the form d = designfilt(resp,Name,Value) to design a digital filter, d, with response type resp. Specify the filter further using a set of Name,Value pairs.
Type d.Coefficients to obtain the coefficients of a digitalFilter, d. For IIR filters, the coefficients are expressed as second-order sections.
Lowpass IIR Filter
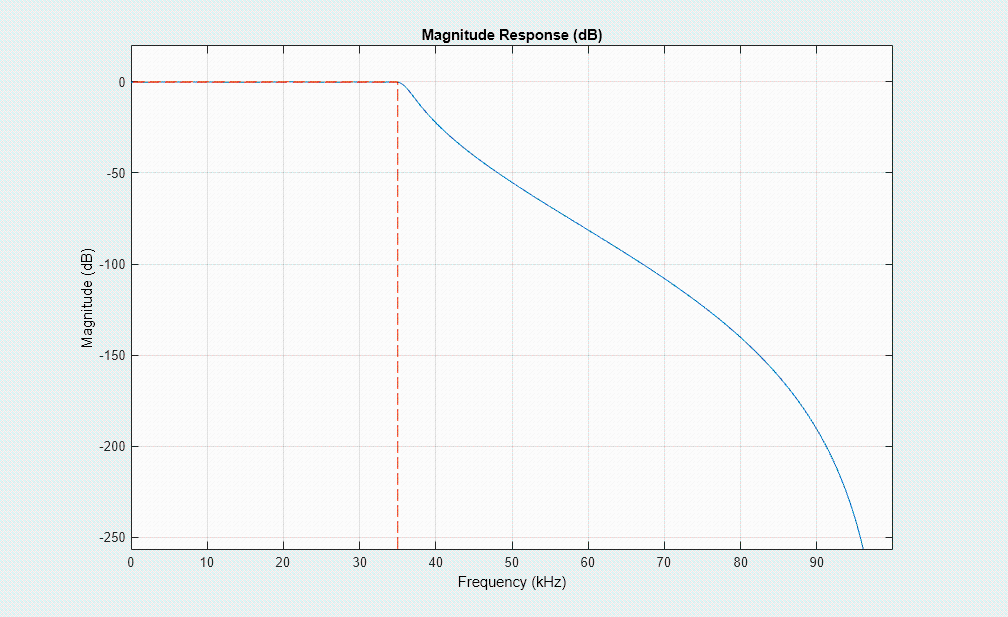
Design a lowpass IIR filter with order 8, passband frequency 35 kHz, and passband ripple 0.2 dB. Specify a sample rate of 200 kHz. Visualize the magnitude response of the filter. Use it to filter a 1000-sample random signal.
lpFilt = designfilt('lowpassiir','FilterOrder',8, ...
         'PassbandFrequency',35e3,'PassbandRipple',0.2, ...
         'SampleRate',200e3);
fvtool(lpFilt)
dataIn = randn(1000,1);
dataOut = filter(lpFilt,dataIn);
Output the filter coefficients, expressed as second-order sections.
sos = lpFilt.Coefficients
sos = 4×6

    0.2666    0.5333    0.2666    1.0000   -0.8346    0.9073
    0.1943    0.3886    0.1943    1.0000   -0.9586    0.7403
    0.1012    0.2023    0.1012    1.0000   -1.1912    0.5983
    0.0318    0.0636    0.0318    1.0000   -1.3810    0.5090
Bandpass FIR Filter
Design a 20th-order bandpass FIR filter with lower cutoff frequency 500 Hz and higher cutoff frequency 560 Hz. The sample rate is 1500 Hz. Visualize the magnitude response of the filter. Use it to filter a random signal containing 1000 samples.
bpFilt = designfilt('bandpassfir','FilterOrder',20, ...
         'CutoffFrequency1',500,'CutoffFrequency2',560, ...
         'SampleRate',1500);
fvtool(bpFilt)
dataIn = randn(1000,1);
dataOut = filter(bpFilt,dataIn);
Output the filter coefficients.
b = bpFilt.Coefficients
b = 1×21

   -0.0113    0.0067    0.0125   -0.0445    0.0504    0.0101   -0.1070    0.1407   -0.0464   -0.1127    0.1913   -0.1127   -0.0464    0.1407   -0.1070    0.0101    0.0504   -0.0445    0.0125    0.0067   -0.0113 ⋯
6.fvtool
fvtool(b,a)
fvtool(sos)
fvtool(d)
fvtool(b1,a1,b2,a2,…,bN,aN)
fvtool(sos1,sos2,…,sosN)
fvtool(Hd)
fvtool(Hd1,Hd2,…,HdN)
h = fvtool(…)
Use fvtool to visualize a digitalFilter, d.
免责声明:本站所有文章内容,图片,视频等均是来源于用户投稿和互联网及文摘转载整编而成,不代表本站观点,不承担相关法律责任。其著作权各归其原作者或其出版社所有。如发现本站有涉嫌抄袭侵权/违法违规的内容,侵犯到您的权益,请在线联系站长,一经查实,本站将立刻删除。 本文来自网络,若有侵权,请联系删除,如若转载,请注明出处:https://yundeesoft.com/33959.html

